Projection#
[1]:
import matplotlib.pyplot as plt
import numpy as np
from manim import *
config.media_embed = True
def figtoimg(fig):
fig.canvas.draw()
img = fig.canvas.buffer_rgba()
plt.close(fig)
return img
# Fixing random state for reproducibility
np.random.seed(19680801)
# some random data
x1 = np.random.normal(2, 0.2, 100)
y1 = np.random.normal(2.2, 0.8, 100)
x2 = np.random.normal(3.5, 0.2, 100)
y2 = np.random.normal(3, 0.5, 100)
def make_plot(x_tracker, y_tracker):
fig, ax = plt.subplots(figsize=(4, 3), dpi=300)
ax.set_xlim(0, 5)
ax.set_ylim(0, 5)
ax.scatter(x1, y1, color="oldlace")
ax.scatter(x2, y2, color="aliceblue")
ax.scatter(x1 * x_tracker, y1 * y_tracker, color="tab:orange")
ax.scatter(x2 * x_tracker, y2 * y_tracker, color="tab:blue")
return figtoimg(fig)
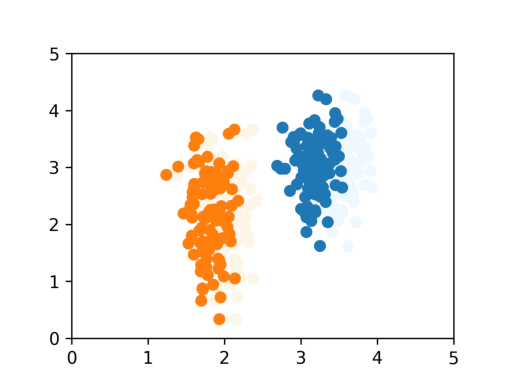
plt.imshow(make_plot(0.9, 1))
plt.axis("off")
Manim Community v0.17.2
[1]:
(-0.5, 1199.5, 899.5, -0.5)
[2]:
class Example(Scene):
    def construct(self):
        self.camera.background_color = BLUE_A
        amp1 = 1
        amp2 = 0.1
        tr_amplitude1 = ValueTracker(amp1)
        tr_amplitude2 = ValueTracker(amp1)

        image = ImageMobject(make_plot(1, 1))
        self.add(image)

        def update_image(mob):
            new_mob = ImageMobject(
                make_plot(tr_amplitude1.get_value(), tr_amplitude2.get_value())
            )
            mob.become(new_mob)

        image.add_updater(update_image)
        self.play(tr_amplitude1.animate.set_value(amp2), run_time=1)
        self.play(tr_amplitude1.animate.set_value(amp1), run_time=1)
        self.play(tr_amplitude2.animate.set_value(amp2), run_time=1)
        self.play(tr_amplitude2.animate.set_value(amp1), run_time=1)


%manim -v WARNING -qh --disable_caching --progress_bar None Example